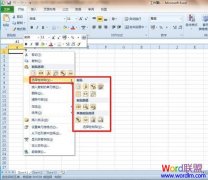
步骤一、首先,打开Excel表格,然后鼠标左键单击选中需创建迷你图表的单元格,切换到“插入”功能选项卡中,在“迷你图”组中,单击一种迷你图表类型(目前只有3种迷你图:拆线图、柱线图、盈亏图)按钮(此处选择“柱形图”),打开“创建迷你图”对话框。如下图:
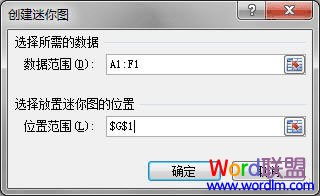
步骤二、利用“位置范围”右侧的折叠按钮,选中显示迷你图表的单元格,单击“确定”按钮,这时,迷你图自动插入到了单元格中。如下图:
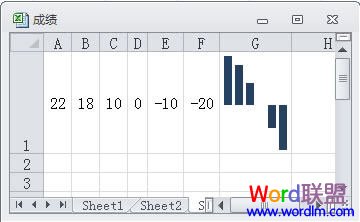
选中迷你图表所在的单元格,软件会展开“迷你图工具/设计”功能选项卡,你可以利用其中的相关功能按钮,对迷你图作出更多的修改。